


Painting a Bright Future for XRF
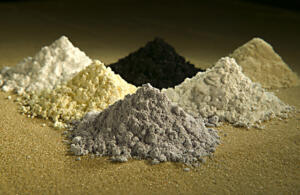
Findings of an ongoing regional evaluation study over concealed Proterozoic lithologies known to host magmatic nickel sulphides with potential to host other base-metal, gold and rare earth elements (“REE”) systems within the Fraser Range, Western Australia.