^

Application of Next Generation Technology in Undercover Exploration

findings of an ongoing regional evaluation study over concealed Proterozoic lithologies known to host magmatic nickel sulphides with potential to host other base-metal, gold and rare earth elements (“REE”) systems within the Fraser Range, Western Australia
Nigel W. Brand1,2,, David J. Crook3
1Portable Spectral Services, West Perth, Australia
2Centre for Exploration and Targeting, University of Western Australia
3Mount Ridley Mines Limited, West Perth, Australia

Abstract

As mineral exploration increasingly pushes into concealed (covered) terrains, explorers must maximise the geochemical and mineralogical information gained to understand the geological setting, terrain prospectively and mineral potential at various scales. Routine, low-cost geochemical techniques enable explorers to look for anomalies within the cloud of data however mineralogical techniques that, at best provide data on the dominant mineral phases (e.g. x-ray diffraction, “XRD”), are expensive, low volume (e.g. scanning electron microscope “SEM”) or qualitative (e.g. short-wave infrared “SWIR”).  We present the findings of an ongoing regional evaluation study over concealed Proterozoic lithologies known to host magmatic nickel sulphides with the potential to host other base-metal, gold and rare earth elements (“REE”) systems within the Fraser Range, Western Australia.  The data has been acquired by Micro-XRF mapping technology which can accurately quantify the chemical compositions, and through post-processing, identify and quantify the mineralogy of the same geological sample.  High-quality, quantitative analyses were undertaken of “end of hole” air core drill samples representing the freshest nature of the rock being drilled. The resulting datasets have identified new mineralogical features and detected chemical differences at a microscale.  The Bruker M4 TORNADOPLUS “Micro-XRF” was utilised in this study, providing rapid and non-destructive acquisition of data.

1. Introduction

Yet to be discovered mineral deposits are becoming more likely to occur in concealed terrains and the ability to see through cover to detect and understand the nature of the underlying bedrock ore environment has become a fundamental aspect of modern mineral exploration and ore deposit science (Winterburn et al 2020), with an increasing appetite for collecting and integration of mineralogical and chemical data.

Over the past two decades, commercial laboratories have offered high volume, low-cost, routine, quantified multi-element geochemical analyses that are accurate and precise over ten (10) orders of magnitude, from 100 percent to parts per billion.  This has given rise to an increasing demand for mineralogical information, however, a commercial high volume, low-cost, routine mineralogical identification technique does not currently exist.  SEM techniques provide mineralogical data at the sub-percent range yet do not provide a routine solution due to high cost and very low production volumes; XRD at best covers analyses within three (3) orders of concentration magnitude (100% to ~1%); whilst techniques such as SWIR are high volume and low cost, however, are qualitative at best.  

Advances in Micro-XRF technology, such as capillary optics, have enabled mapping at high spatial resolution, down to 20um, without sacrificing intensity or sensitivity, providing a non-destructive, quantitative method for geochemical analysis and mineralogy of samples whilst providing the spatial distribution of major, minor and abundant trace components at the mapped resolution (Fritz et al 2016; Hoehnel 2018). During mapping the entire X-ray spectrum for each pixel in the grid is collected.  Geochemically, elements ranging from carbon (C) to uranium (U) are simultaneously measured with quantification limits ranging from percentages to parts per million.  

Automated mineralogy is undertaken using BRUKER’s Advanced Mineral Identification and Characterisation Software (AMICS) through spectral matching of an extensive real-world and synthetic mineral library.  Through automation, high volume throughput can be achieved which enables the routine commercial application of this technology.  

The applicability of this technology for a practical solution when exploring a concealed geological terrain is being tested under a research project sponsored by Mount Ridley Mines Limited.  To date, the project has analysed over 600 drill samples collected within an area of 1,200km2 concealed Proterozoic terrain. This forms an exploration workflow that identifies rock types to produce a geological map with overlays of potential ore-environment minerals utilising both mineralogical and chemical vectors.  

The project area lies within the Biranup and Nornalup geological provinces of the Albany–Fraser Orogen which forms part of the West Australian Craton and is located along the south-eastern margin of the Archean Yilgarn Craton (Spaggiari et al 2011).  The Albany–Fraser Orogen is hosted by predominantly Paleoproterozoic to Mesoproterozoic granites formed through a complex series of events.

2. Methodology

Over 600 end-of-hole drill samples have been scanned during this study.  Initially, selected samples were scanned “as received” at a high resolution (25-30µm) to develop a working mineral reference library using the AMICS software.  With the mineral reference library established, samples are rerun in a validation process at a lower resolution (100-200µm) to test accuracy and precision for high volume throughput.  

Once validation is completed, routine samples are cleaned and mounted “as received” in batches of ~ 24 samples with no additional preparation (Figure 1). These mounts are loaded and scanned using a BRUKER M4PLUS TORNADO.  Quantified geochemical analysis is undertaken using the M4 software and quantified mineralogical analysis is undertaken using AMICS.  Any “unknown” minerals encountered at this stage are further assessed and when identification is verified, these will be added to the mineral reference library.

Results from the study to date has identified thirty-one (31) minerals. Common rock forming minerals and minerals associated with regional metamorphism are abundant.
Figure 1: End of hole samples (left), chemistry (centre), mineralogy (right).

3. Results

Results from the study to date has identified thirty-one (31) minerals. Common rock forming minerals and minerals associated with regional metamorphism are abundant. Primary economic minerals as well as alteration minerals associated with ore environments are present in lower concentrations, typically less than 0.5% of the rock volume. Identification of ore environment minerals however is crucial when vectoring towards concealed ore deposits (Figure 2).

Given the nature of the cover sequence and weathering effects in the study area, the potential to generate false anomalies is recognised when interpreting geochemical data only. Identification of secondary mineral phases associated with a geochemical anomaly and then correlation of these minerals with the underlying basement or potential ore environment is a means of validating or discounting geochemical anomalies.
For each sample, mineralogical maps are generated showing the spatial distribution of the mineralogy, sample texture, mineral grain size, mineral associated etc (Figure 3).

Figure 2: Abundance (number of times a mineral is identified in the data set) vs Average (average concentration of a mineral phase in the data set
Figure 2: Abundance (number of times a mineral is identified in the data set) vs Average (average concentration of a mineral phase in the data set). “Box A” represents common rock forming minerals and minerals associated with regional alteration. “Box B” represents ore and alteration minerals associated with a mineralized environments providing potential vectors.
Figure 3: Mineralogical map of an “end of hole” sample, MRAC0112.
Figure 4: Individual element distribution maps show the relative element concentration within the sample MRAC0112.
Figure 5: MRAC0112 mineral data *plotted in IUGC diagram (left) and chemical data plotted in Middlemost’ 1994 TAS diagram (right).

Individual element distribution maps visually show the relative element concentration within the sample (Figure 4).  Numerical data is used by the AMICS to ascertain the sample’s constituent minerals.  Common rock-forming minerals can be placed into standard IUGC petrographic diagrams to identify the underlying bedrock, which is then verified with standard geochemical plots using micro-XRF whole-of-sample geochemistry data (Figure 5).

From the end-of-hole drill sample data, the spatial distribution of individual mineral abundances can be shown (Figure 6).  Common rock-forming and metamorphic minerals are used to map the underlying geology.  Primary ore minerals and mineral alteration patterns associated with ore systems provide information on the terrain prospectivity, mineral potential and may act as a vector towards an ore deposit.

4. Conclusions

This paper demonstrates the application of next generation technology in undercover exploration and highlights the importance of detecting routine, high-volume low-cost quality “trace” mineralogy to identify a suite of “indicator” minerals with the potential to vector towards and detect economic mineral systems.  

This pilot study forms part of a much larger regional program undertaken by Mount Ridley Mines Limited to understand the basement geology, and mineral prospectively using a non-destructive micro-XRF technique to quantify mineralogy and chemistry and provide textural and petrography information that is “fit for purpose” for mineral exploration.

Figure 6: The spatial distribution of manganbabingtonite [Ca2(Mn,Fe)FeSi5O14(OH)] a mineral associated with garnet-pyroxene-magnetite skarn.

Acknowledgements

Mt Ridley Mines Limited are thanked for their continuing support in method development and application of non-destructive technology in the mineral exploration.

References

Fritz, J., Tagle, T., Ashworth, L., Schmitt, R.-T., Hofmann, A., Luais, B., Harris, P.D.,Hoehnel, D., Ozdemir, S., Mohr-Westheide, T., Koeberl, C. (2016): Nondestructive spectroscopic and petrochemical investigations of paleoarchean SLs from the ICDP drill core BARB5, Barberton Mountain Land, South Africa. Meteorit. Planet. Sci. 51, 2441e2458.

Hoehnel, D., Reimold, W. U., Altenberger, U., Hofmann, A., Mohr-Westheide, T., Özdemir, S., & Koeberl, C. (2018): Petrographic and Micro-XRF analysis of multiple archean impact-derived spherule layers in drill core CT3 from the northern Barberton Greenstone Belt (South Africa). Journal of African Earth Sciences, 138, 264-288.

Middlemost, E.A.K. (1994): Naming materials in the magma/igneous rock system; Earth-Science Reviews, v. 37, pp. 215-224.

Spaggiari, CV, Kirkland, CL, Pawley, MJ, Smithies, RH, Wingate, MTD, Doyle, MG, Blenkinsop, TG, Clark, C, Oorschot, CW, Fox, LJ and Savage, J. (2011): The geology of the east Albany–Fraser Orogen — a field guide: Geological Survey of Western Australia, Record 2011/23, 97p.

Winterburn, P.A.; Noble, R.R. and Lawie, D. (2020): Advances in exploration geochemistry, 2007 to 2017 and beyond. Geochemistry: Exploration, Environment, Analysis, 20, 157-166.
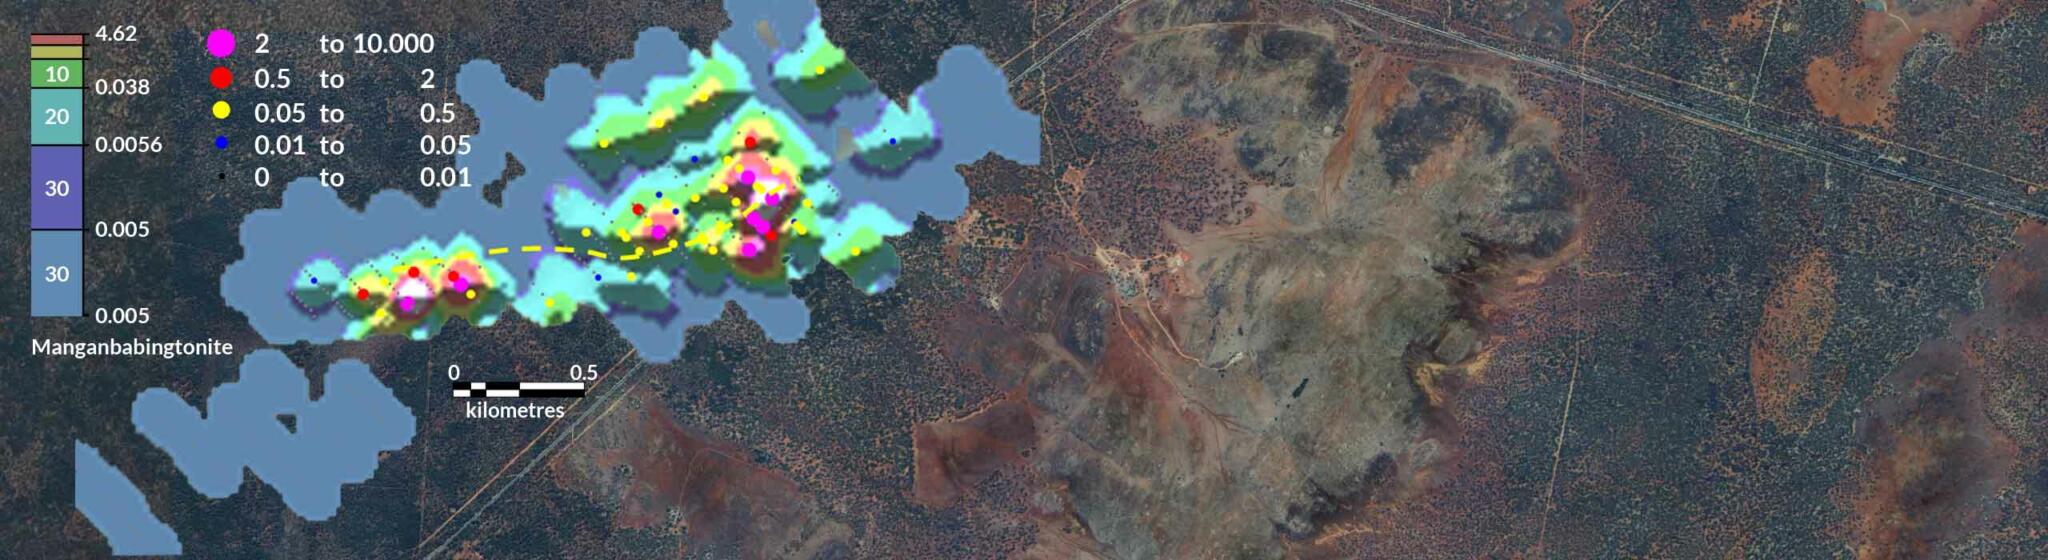
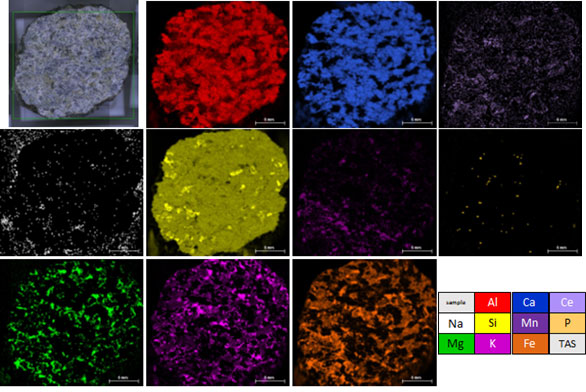
Now Available

Portable Spectral Services’ Schedule of Hire, Support Services & Fees is now available!

Enquire Now

Keywords: