A Bright Future Ahead
Portable Spectral Services Announces Exciting Management Transition
With over 2.25 billion cups of coffee being consumed every day, no wonder we need a day to celebrate it! October 1st is International coffee day and as coffee enthusiasts PSS has decided to take this opportunity to analyse some coffee using the Bruker M4 TORNADO.
Most coffee is consumed as a beverage, so have a sip of your caffeinated drink, get comfy and enjoy this article all about coffee.
The majority of coffee is a product of Brazil, with Vietnam in second and Colombia hot on their heels in third place. In fact, most coffee producers have tropical and subtropical climates who rely on the exportation of this commodity as a main source of GDP. The value of coffee worldwide is approximated at $2 billion per annum. In other words – it makes up 1% of world trade. It is so widely exported and traded, that based on volume it is the second most important product in international commerce (and it is estimated to be first based on value). That is a lot of caffeine!
Two samples of Daley Street Medium Coffee Ground from Coles were analysed, one was used coffee grounds, the other unused (Figure 1). According to Coles, the Daley Street Medium Coffee Ground is a mix of arabica beans from Colombia and Kenya. For this analysis the two samples were analysed side by side in the Bruker M4 TORNADO. It was scanned at 100µm, 20 ms/pixel at 45kV and 600µA.
Figure 1: Image of a subsample of unused coffee grounds (right side) and used coffee grounds (left side).
Calcium, potassium, iron and titanium were present in the samples, with potassium and calcium as the main constituents. Calcium was present in both samples, in similar concentrations (Fig. 2a). As expected, the coffee grounds are variable in size and shape and therefore height within the instrument and so the variability in the composition between the two samples is confirmed using the heat map (Fig. 2b).
Figure 2a: Ca elemental map of both samples. Right Side unused coffee grounds, left side used coffee grounds.
Figure 2b: Ca heat map of both samples. Right Side unused coffee grounds, left side used coffee grounds.
Figure 3a: K elemental map of both samples. Right Side unused coffee grounds, left side used coffee grounds.
Figure 3b: K heat map of both samples. Right Side unused coffee grounds, left side used coffee grounds.
Figure 4: Fe element map of both samples. Right Side unused coffee grounds, left side used coffee grounds.
Figure 5: Ti element map of both samples. Right Side unused coffee grounds, left side used coffee grounds.
The most significant change in concentrations between the two samples was the change in potassium. The unused sample showed a significantly higher concentration to the used sample, which showed very little. A study from 2017 also commented on this effect when analysing various ground coffee samples, stating it was likely that water drags these elements out during the brewing process.[1] This means that during the process of brewing, the heat and/or water contribute to the potassium leaving the sample and going into the water (coffee) for the person to drink.
In terms of the iron and titanium presence in the used coffee grounds, it is unlikely these came from the coffee grounds themselves, as it is not present in the unused coffee grounds from the same product. This is also because other elements of interest seemed to be homogenous in elemental presence and distribution. These grains may potential be a contaminant, as the used sample was dried outside and may have infiltrated into the coffee.
We hope you had a great international coffee day and stay caffeinated.
For more information on micro-XRF spectroscopy visit www.microxrf.com.au/.
Visit our YouTube channel, Professor Spectrum to watch live micro-XRF scans and instructional videos.
If you are interested in having your own sample analysed by micro-XRF, contact Portable Spectral Services p: 08 9321 2830 e: [email protected]
Product information on the Bruker M4 TORNADO micro-XRF.
[1] Zaidi, J. H, I Fatima, M Arif, and I. H Qureshi. “Determination of Trace Elements in Coffee Beans and Instant Coffee of Various Origins by INAA.” Journal of Radioanalytical and Nuclear Chemistry 267, no. 1 (December 2005): 109–12. https://doi.org/10.1007/s10967-006-0015-y.
[2] Hernandez, Maria Cristina, Dario Romero, Humberto Torres, Javier Miranda, and A. LÓPEZ. “X-ray fluorescence analysis of ground coffee.” (2017).
Portable Spectral Services Announces Exciting Management Transition
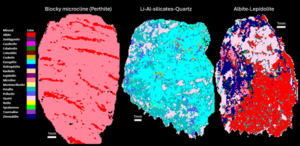
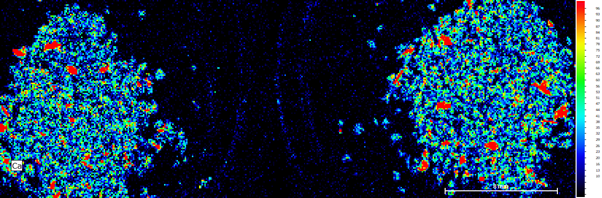
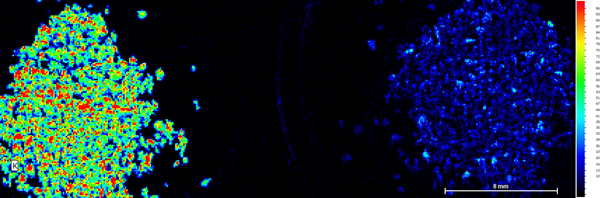
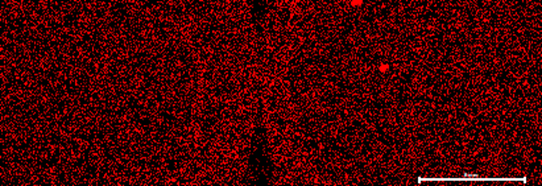
Our tool introduces uXRF (micro-X-ray fluorescence) scanning technology to RC chip analysis, enabling rapid, non-destructive, and quantitative analysis of major, minor, and trace mineral phases.
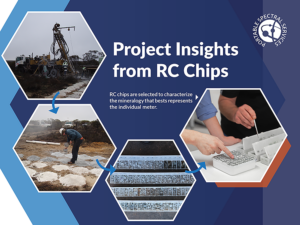
Automated micro-X-ray fluorescence (micro XRF) technology emerges as a powerful tool to rapidly and accurately capture the mineralogy of rock chip, RC and AC samples.
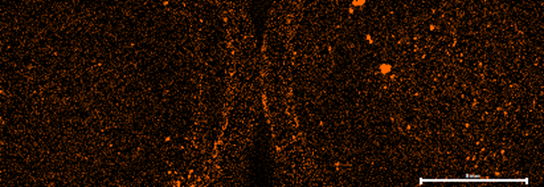
Findings of an ongoing regional evaluation study over concealed Proterozoic lithologies known to host magmatic nickel sulphides with potential to host other base-metal, gold and rare earth elements (“REE”) systems within the Fraser Range, Western Australia.