^

Good data gives good results: QAQC of NIR data

As the saying goes, the data you get out will only be as good as the data going in. With this in mind it is important to understand how to properly QAQC your data and where some of the pitfalls are in the data collection process. In this article we’ll discuss the quality assurance and control part of the workflow for NIR spectroscopy, along with one of the key sampling pitfalls that can impact the quality of your data.

So you’ve got a NIR spectral dataset, how do you know if your data is any good? Below outlines a simple QAQC workflow and post analysis QAQC of spectral data. In the minerals industry, most people use a TerraSpec NIR instrument and The Spectral Geologist (TSG) software; so I’ll provide you some tips using this instrument and software.

QAQC sampling workflow

1. Check the condition of the TerraSpec and the fibre optic cable
2. Optimise and white reference the instrument using a ‘clean’ spectralon disc*
3. Analyse mylar film
4. Analyse samples while completing a white reference every 30 to 60 minutes
5. Analyse mylar film
6. Import data to the TSG and undertake post-analysis QAQC

*ASD provides a good video on how to clean your spectralon disc

Post Analysis QAQC

TerraSpec instruments come with a mylar film that is analysed to test whether the instrument is properly tuned. The mylar spectral absorption features should be within 1 nm of their reported values (Fig. 1). A mineralogical standard, with well-known spectral absorption features, can also be used in lieu of the mylar and is a better candidate since we are trying to identify minerals at the end of the day! If you are observing a deviation of more than 1 nm then you instrument may need to be serviced.

Figure 1 – Mylar film analysis over a study period showing the instrument operated within the acceptable ± 1nm range with no major fluctuations.

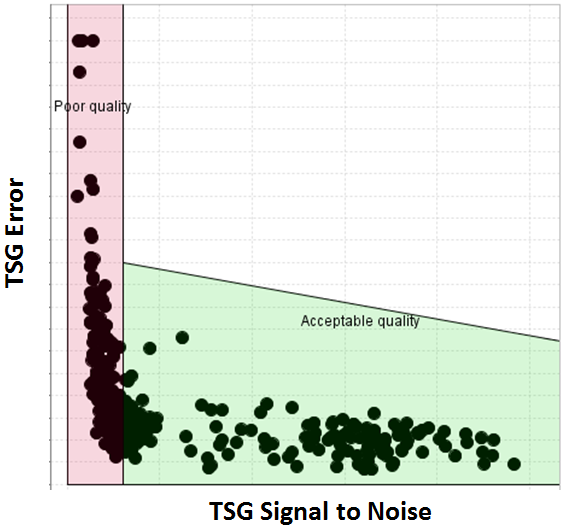
A useful method to assess spectral quality is to plot the TSG ‘signal to noise ratio’ against ‘error’ outputs (Fig. 2). However, you need be aware that some mineralogy is not active in the NIR spectrum and will plot in the poor quality zone; so your data may be good, it’s just that it has some non-active NIR mineralogy.

Figure 2 – QAQC of spectral quality (TSG signal to noise versus Error) showing a group of data plotting in the poor quality box that should be excluded from the spectral database.

Water contamination is another parameter we need to check as wet samples cause havoc to spectral interpretation. Plotting the TSG ‘unbound water’ versus ‘bound water’ will help discriminate wet samples versus dry samples (Fig. 3). Some minerals like your clays are naturally wet, and often tent to have a higher amount of unbound water. Unfortunately, spectra with high unbound water cannot be fixed once collected so ensure your samples have been properly dried prior to your data collection! See below to understand the effect unbound water can have on your samples.

Figure 3 – Water contamination (TSG bound water versus unbound water) discrimination diagram showing a group of samples with water contamination that should be excluded from the spectral database.

Your dataset is ready

Once you have run your dataset through this simple QAQC procedure you will be more confident in the reliability of your results. If you have some spectra that fail the QAQC tests, not to worry, it is important to know whether there are any areas of unreliable information that you may need to watch out for. If a large portion of your data has failed the QAQC then you may want to consider checking your data collection technique and recollecting the data for a more reliable dataset. Once you are confident in your dataset you can begin to map the spatial distribution of minerals and their spectral features!

The pitfall of NIR interpretation - Wet samples!

Often, we receive ‘wet’ RC chip samples straight from the drill rig to be analysed with the TerraSpec ASD, or spectral datasets that show evidence of wet samples. Water can severely reduce the quality of the spectrum and limit the reliability of the resulting interpretation.
Here is why you need dry samples.

1. The NIR region of the electromagnetic spectrum is particularly sensitive to hydroxide bonds and water. Many minerals contain water that is ‘bound’ in the mineral structure like smectites, halloysite and gypsum. However, samples can contain ‘unbound’ water which is not related to a mineral such as water hosted in the porosity of the rock (i.e. wet samples) or fluid inclusions in quartz.
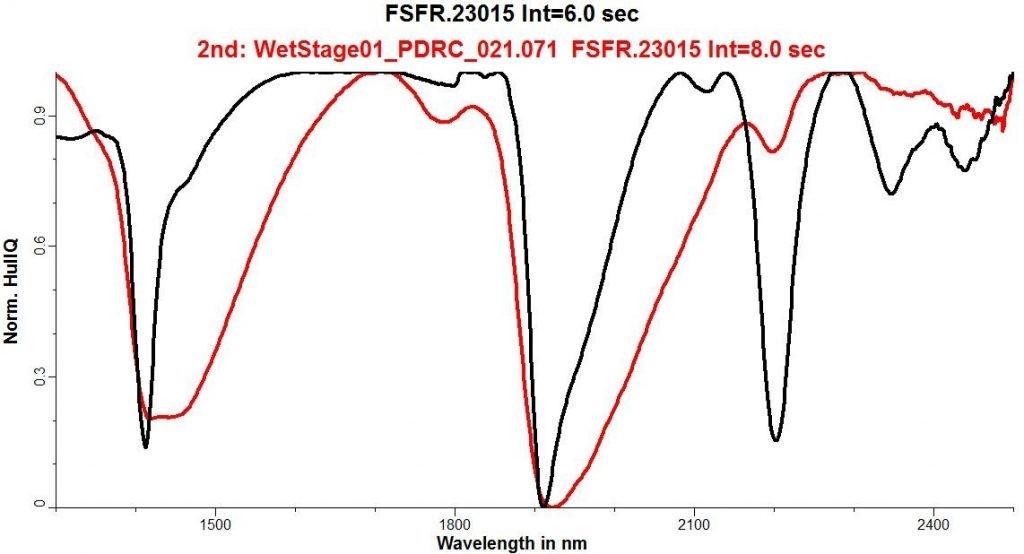
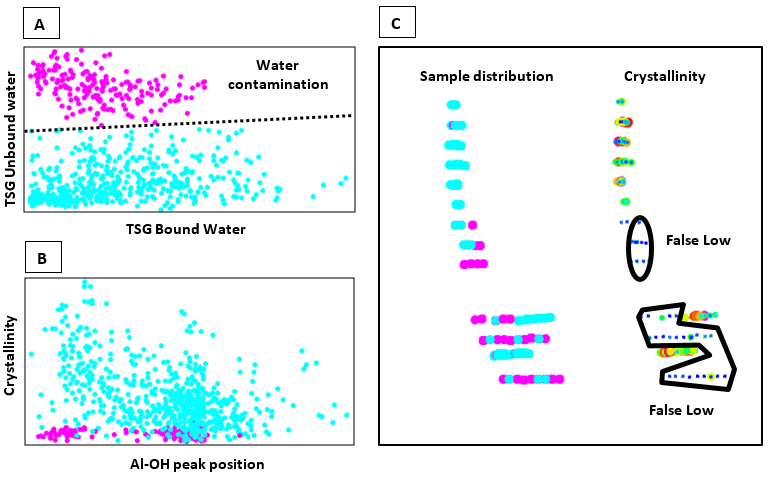
2. Wet samples can dramatically reduce the quality of the spectrum. For example, water will dominate the spectrum and reduce the quality of the absorption features from the minerals of interest (Fig. 1). A dataset can be examined for water contamination by plotting the output of bound and unbound water values on The Spectral Geologist (TSG) spectral interpretation software (Fig. 2A). Wet samples will also produce spurious white mica crystallinity results, as the water contaminated samples will have lower crystallinity values (Fig. 2B). Without the recognition of water-contaminated samples in the dataset, an incorrect interpretation can result because the data will produce false lows or conversely false highs when plotting the distribution of crystallinity values (Fig 2C).

Figure 1 – Spectra of a muscovitic illite bearing sample, analysed when the sample was wet (red spectrum; visible water on sample) and after drying for 24 hours (black spectrum). The absorption features in the dry sample are markedly sharper allowing for a more robust interpretation.


Figure 2 – An example of a dataset where white mica samples contain evidence of water contamination. A – Samples with water contamination can be detected by plotting the TSG (The Spectral Geologist) spectral interpretation software output of bound and unbound water values. B and C – White mica samples with water contamination will have spurious low crystallinity values that will create false lows or alternatively false crystallinity highs when plotting the crystallinity spatially. Legend – Pink: samples with water contamination. Blue: samples with no water contamination.

So how should you dry your samples? Ideally, samples should be dried below ~40°C since anything higher than this can change the structure of some minerals (e.g. illite). The recommended method is putting them in a low temperature oven for 24 hours. If that is not available, then put the samples in the sun on a hot day or in front of a heat pump until any visible moisture is removed from the sample.

Written by Nick Jansen, 2016.
Complied by Sophie Perring, 2020.

Recent Article

Signal To Noise in XRF Technology

Findings of an ongoing regional evaluation study over concealed Proterozoic lithologies known to host magmatic nickel sulphides with potential to host other base-metal, gold and rare earth elements (“REE”) systems within the Fraser Range, Western Australia.

Read More »

GEMA: A Revolution in Material Analysis

Findings of an ongoing regional evaluation study over concealed Proterozoic lithologies known to host magmatic nickel sulphides with potential to host other base-metal, gold and rare earth elements (“REE”) systems within the Fraser Range, Western Australia.
Read More »

The Tiny Powerhouses: Pumpkin Seeds

Findings of an ongoing regional evaluation study over concealed Proterozoic lithologies known to host magmatic nickel sulphides with potential to host other base-metal, gold and rare earth elements (“REE”) systems within the Fraser Range, Western Australia.

Read More »

Exploring Rare Earth Elements

Demand for Rare Earth Elements (REE) continues to increase as the globe migrates to renewable energy. Exploration for REE have significantly increased over the last

Read More »

Now Available

Portable Spectral Services’ Schedule of Hire, Support Services & Fees is now available!

Enquire Now

Keywords: